 Skip to main content

Students and families often have questions about the information provided in their SAT Score Report. To help you better understand your scores, we’ve put together a helpful guide.
Remember, your Section scores and Total score are what matter most to colleges.
Subscores provide more specific information for how you might focus your test preparation.
Cross-Test Scores and Subscores are typically not used in college admissions decisions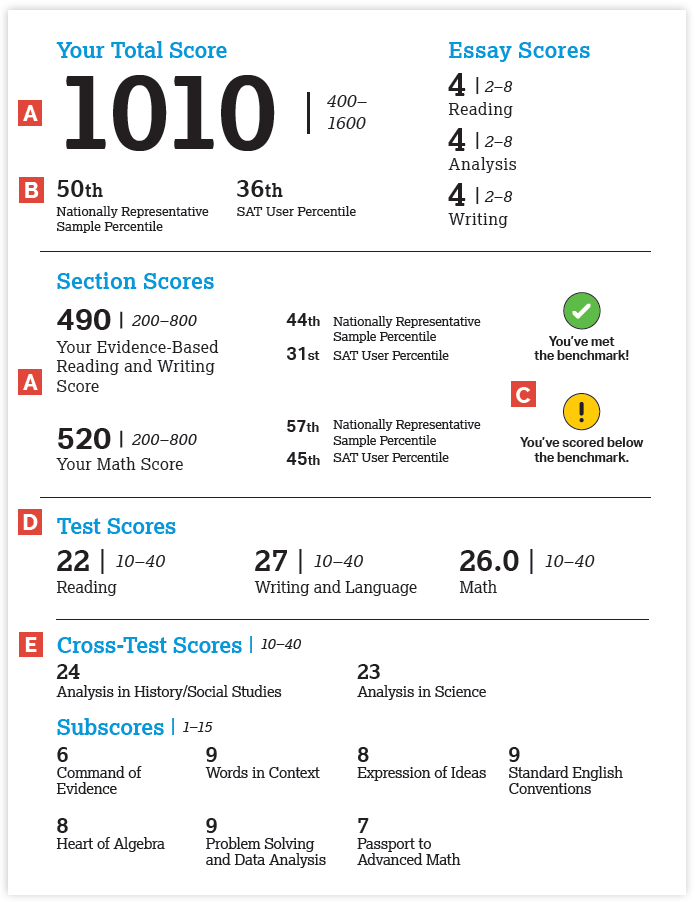
A The Total Score (400-1600) and Section Scores (200-800) are the most important scores when applying to college. The Essay Scores are not factored into the Total or Section scores.
B Percentiles show your relative standing among other students. The “Nationally Representative” percentile is based on data for all U.S. students, including students who did not take the SAT. The “SAT User” percentile is based on actual scores of students who took the SAT.
C The benchmark is a measure of your college readiness. The benchmark for Evidence-Based Reading & Writing is 480. The benchmark for Math is 530.
D Test Scores are used to calculate Section Scores. Multiplying the sum of the Reading and the Writing & Language Test Scores by 10 gives the Evidence-Based Reading & Writing Section Score. Multiplying the Math Test Score by 20 gives the Math Section Score.
EBRW Score: (22 + 27) × 10 = 490
Math Section Score: 26 × 20 = 520
E Cross-Test Scores are based on history and science-related questions spread throughout the SAT. There is no dedicated history or science section on the test. Cross-Test Scores are used primarily as assessment tools for schools.
As always, feel free to reach out with any questions. Standardized testing for college admissions can be confusing and overwhelming. We are here to help. Please feel free to contact us or leave a note in the comments box below.


Enlighten me further how results of SAT are interpreted. Am a school counselor and one of my students in grade 9 who is joining one of the high schools in US, sat for SAT examinations on December 7, 2019 and obtained a total score of 950, and she was in 38th percentile. Does this mean her performance was below average performance? please advise.
Regards,
Wilber Muwoya
For a 9th grader, the scores will be a bit misleading, because the SAT percentiles are used for older students. Among 11th and 12th graders, your student would be in the 38th percentile. She would rank much better among her 9th grade peers.
If you check the scoring data for the PSAT 8/9, your student’s 950 puts her in about the 69th percentile of 9th graders, which is well above average!
Thank you. This is helpful. But how do they calculate the test scores? That seems to be the mystery of these tests. It does not appear to be a one on one correlation to a correct answer.
Hi Julie, thank you for your question. Raw scores are calculated by adding up the total number of correctly answered questions. Raw scores are then converted to scaled scores using a statistical process called “equating”. Equating ensures that a scaled score on one test date is equivalent to a scaled score from another test date. This normalizes any small differences in difficulty across tests. For example, a single incorrect answer on one test could equal two or three incorrect answers on a more difficult test. I hope that helps. We are always available to answer any additional questions!